very_fast_eda Tutoriral
Welcome to very_fast_eda package documentation! This package offers a suite of functions designed to smplify your EDA. below is an illustration of the usage of the functions with real life examples, featuring, Bill, a student at UON, who is undertaking his final year project on data analysis.
Bill’s Journey
For the last four years in college Bill has been used to perform exploratory data analysis using his computer and an excel spreadsheet. He found it to be very time consuming and frustrating at time if he has very large data sets. His friend, Mark, came across this package and recommended him to use it. After pondering for sometime, he decided to give it a try and he was not dissapointed. Infact, he went ahead to introduce it to his professors and fellow classmates.
Putting the fast_eda package into use
To start he had to import all the necessary libraries and the module from our packages as an alias eda
Import
import seaborn as sns
import pandas as pd
import fast_eda.fast_eda as eda
Load a sample dataset
Bill then went ahead to load the data set he will be using for his analysis. He choose the famous Iris dataset from the Seaborn library (Iris dataset). He could use any data set if he wanted but he has to ensure that is the format of a pandas dataframe.
iris = sns.load_dataset('iris')
iris.head()
| sepal_length | sepal_width | petal_length | petal_width | species | |
|---|---|---|---|---|---|
| 0 | 5.1 | 3.5 | 1.4 | 0.2 | setosa |
| 1 | 4.9 | 3.0 | 1.4 | 0.2 | setosa |
| 2 | 4.7 | 3.2 | 1.3 | 0.2 | setosa |
| 3 | 4.6 | 3.1 | 1.5 | 0.2 | setosa |
| 4 | 5.0 | 3.6 | 1.4 | 0.2 | setosa |
Bill wanted to get more information about the dataset and therefore he uses iris.info() to get a summary of the dataframe but this is not enough for analysis. He wants to know about the distriubution, correlation, null counts, and some summary statistics.
iris.info()
<class 'pandas.core.frame.DataFrame'>
RangeIndex: 150 entries, 0 to 149
Data columns (total 5 columns):
 #   Column        Non-Null Count  Dtype
---  ------        --------------  -----
 0   sepal_length  150 non-null    float64
 1   sepal_width   150 non-null    float64
 2   petal_length  150 non-null    float64
 3   petal_width   150 non-null    float64
 4   species       150 non-null    object
dtypes: float64(4), object(1)
memory usage: 6.0+ KB
Therefore, Bill then went ahead to use the functions in the package to undertake his analysis of the dataset.
Exploratory Data Analysis
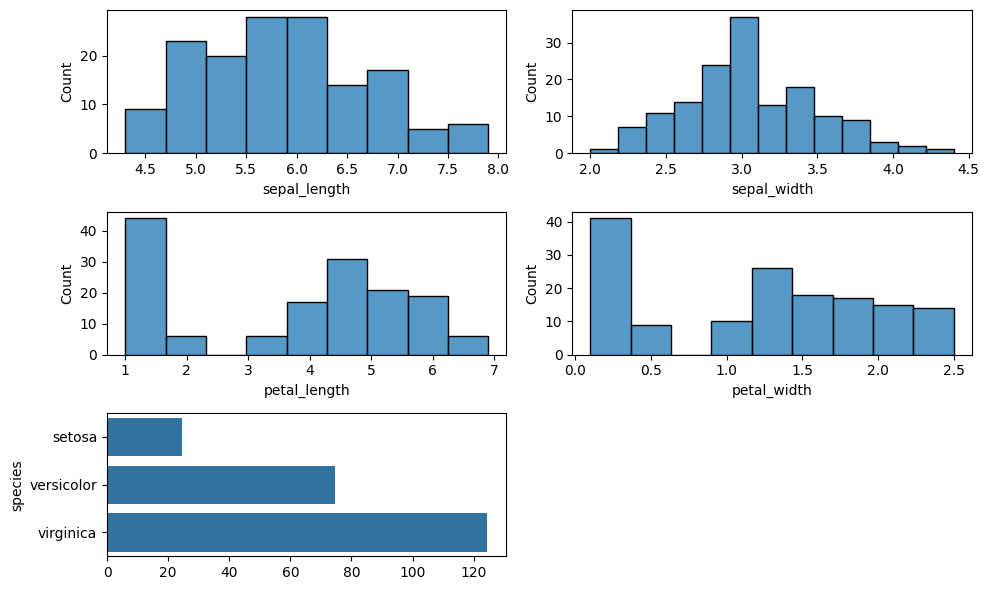
Here he could see the distribution plot of all the columns and he derived some insights from it.
dist_plots = eda.distribution_plots(iris, 2, 3)
Here Bill was able to know how many values are missing in any given column that might affect his analysis.
nulls_values = eda.count_nulls(iris)

nulls_values
sepal_length    0
sepal_width     0
petal_length    0
petal_width     0
species         0
dtype: int64
Bill was also able to see the correlation of the different features in the dataset.
correlation_matrix_plot = eda.correlation_matrix_viz(iris).properties(
    width=400,  # Adjust width as needed
    height=200  # Adjust height as needed
)
correlation_matrix_plot
Finally, bill was able to see summary statistics about the different columns in the dataset.
Data Statistics Calculation: mean, median, and stdv
df = sns.load_dataset('iris')

# Get all numerical columns
numerical_columns = df.select_dtypes(include=['number']).columns.tolist()

print("\nNumerical columns in the Iris dataset:")
print(numerical_columns)

df = iris[numerical_columns]

eda.describe_function(df)
Numerical columns in the Iris dataset:
['sepal_length', 'sepal_width', 'petal_length', 'petal_width']
| sepal_length | sepal_width | petal_length | petal_width | |
|---|---|---|---|---|
| count | 150.000000 | 150.000000 | 150.000000 | 150.000000 |
| mean | 5.843333 | 3.057333 | 3.758000 | 1.199333 |
| std | 0.828066 | 0.435866 | 1.765298 | 0.762238 |
| min | 4.300000 | 2.000000 | 1.000000 | 0.100000 |
| 25% | 5.100000 | 2.800000 | 1.600000 | 0.300000 |
| 50% | 5.800000 | 3.000000 | 4.350000 | 1.300000 |
| 75% | 6.400000 | 3.300000 | 5.100000 | 1.800000 |
| max | 7.900000 | 4.400000 | 6.900000 | 2.500000 |
Final Remarks
We hope you found these examples informative and learned through Bills experience. If anything remains unclear, we suggest reviewing the function documentation or creating an issue in our repository and we will get back to you.